
Higher Ed Social Media Benchmarks for Colleges & Universities
Engagement rates, follower growth, posting frequency, and content performance across 3,960 higher ed accounts on Instagram, Facebook, and TikTok — in one place.
Platforms at a Glance
Rolling 30-day averages for main university accounts — tap a platform for the full breakdown by school size, division, location, and account type
| Platform | Tracked Accounts | Engagement Rate | Growth % | Avg Posts (30d) | Top Format | |
|---|---|---|---|---|---|---|
| 2.1K | 1.89% | +299.92% | 14 | Carousel · 2.18% | Full report | |
| 1.1K | 0.26% | +0.32% | 10 | Single Image · 0.31% | Full report | |
| TikTok | 691 | 5.25% | +2.03% | 5 | Video · 4.73% | Full report |
Benchmarks by Platform
Headline numbers from each platform report — every page breaks these down by school size, division, location, and account type
Instagram Benchmarks
Engagement Rate
1.89%
Follower Growth
+299.92%
Posts / 30 Days
14
Avg Followers
31,073
Most common content: Campus Life (57.9% of posts)
View full Instagram benchmarksFacebook Benchmarks
Engagement Rate
0.26%
Follower Growth
+0.32%
Posts / 30 Days
10
Avg Followers
76,070
Most common content: Campus Life (23.8% of posts)
View full Facebook benchmarksTikTok Benchmarks
Engagement Rate
5.25%
Follower Growth
+2.03%
Posts / 30 Days
5
Avg Followers
14,494
Most common content: Campus Life (28.6% of posts)
View full TikTok benchmarksEngagement Rate by School Size
Smaller schools tend to out-engage larger ones on a rate basis — find your enrollment bracket to see a realistic bar on each platform
| School Size | TikTok | ||
|---|---|---|---|
| Under 1K | 1.81% | 0.4% | 3.24% |
| 1K – 5K | 2.01% | 0.33% | 6.56% |
| 5K – 10K | 2.48% | 0.12% | 2.95% |
| 10K – 20K | 1.27% | 0.1% | 5.04% |
| 20K – 30K | 1.48% | 0.15% | 2.72% |
| 30K+ | 0.98% | 0.1% | 7.05% |
Average engagement rate for main university accounts, rolling 30-day window. Full breakdowns by division, location, and level live on each platform's report.
What Content Performs Best
The most common content categories on each platform — compare how much schools post a category against how well it actually engages
- Campus Life57.9% · 2.2% ER
- Academic Content31.9% · 1.07% ER
- Current Student Features29.2% · 1.47% ER
- Open House/Campus Event Promotion28.4% · 1.28% ER
- Orientation27.5% · 2.19% ER
- Campus Life23.8% · 0.28% ER
- Academic Content16.1% · 0.19% ER
- Research & Innovation14.1% · 0.14% ER
- Current Student Features10.3% · 0.3% ER
- Official Announcement9.4% · 0.38% ER
TikTok
- Campus Life28.6% · 3.06% ER
- Move In/Move Out9.4% · 7.02% ER
- Current Student Features9.2% · 2.67% ER
- Orientation7.7% · 5.03% ER
- Aesthetic Content6.9% · 3.99% ER
Today's Top Posts in Higher Ed
The highest engagement rate on each platform in the last daily snapshot — what beating the benchmark actually looks like
@
2 days ago
Big things R happening at the New Jersey State House, where Sir Henry, Scarlet Raider, and Scarlet Raptor traded campus for the Capitol on Tuesday. The legendary trio made themselves right at home, roaming the halls, making friends, and showing off true Rutgers Pride - all while taking cool pictures. Together, the trio represents Rutgers' statewide impact. A massive financial engine for the state, Rutgers generates $13.3 billion in annual economic impact. Every $1 NJ invests in Rutgers yields $11.49 in return, supporting 69,239 jobs statewide and injecting nearly $1 billion into research annually. One State University. Three mascots. One State House. A whole lot of Jersey pride. Thanks so much for the hospitality, @njgov. Felt like home. #rutgerspride
@
2 days ago
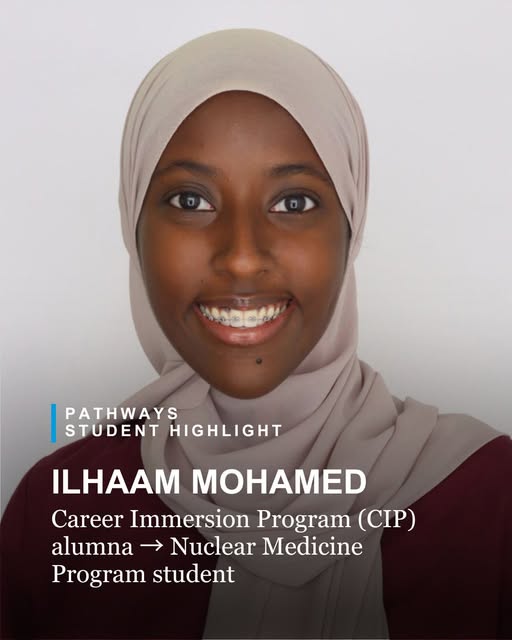
One summer program helped her discover her future in Nuclear Medicine. Before participating in Mayo Clinic's Career Immersion Program, Ilhaam Mohamed knew about only a handful of healthcare professions. Through the program, she explored a variety of careers and gained a deeper understanding of the many ways healthcare teams contribute to patient care. Sessions focused on Nuclear Medicine and physical therapy captured her attention, introducing her to fields she had not previously considered. The experience ultimately inspired her to pursue Nuclear Medicine as a career. To prepare for that future, Ilhaam gained clinical experience through phlebotomy and continued building the skills needed to work with patients. This fall, she will begin Mayo Clinic's Nuclear Medicine Program. Her story demonstrates how pathways programs help learners explore possibilities, discover interests and take meaningful steps toward healthcare careers.
@
2 days ago

Our new Vikes could use some new swag! 💚 All new and transfer students are welcome to attend New Student Convocation on Saturday, Aug. 22, from 11 a.m. to noon at Waetjen Auditorium. Meet the University leadership team, college deans and, of course, get some CSU swag. Then, join us on Euclid Ave. after Convocation for VikesFEST! 🎉 Welcome to #CleState!
This is one slice of Today's Snapshot
The full daily report adds AI-picked standout posts, trending hashtags, fastest-growing schools, and engagement by content type — refreshed every morning at 9 AM ET.
What the Numbers Mean
Plain-English context to help your team read the current rolling 30-day benchmarks across platforms.
In the latest rolling 30-day window across main university accounts: Instagram averages a 1.89% engagement rate with 299.92% monthly follower growth, Facebook averages a 0.26% engagement rate with 0.32% monthly follower growth, TikTok averages a 5.25% engagement rate with 2.03% monthly follower growth.
TikTok currently leads on engagement rate while Instagram leads on follower growth. Platform averages hide wide variation by school size, division, and account type, so treat these as directional context rather than targets.
Benchmark against peers on each platform separately — audience behavior, format mix, and posting cadence differ enough that a single cross-platform target misleads. Start from the platform your enrollment audience actually uses most, then work format-by-format.
Dig into the full reports for Instagram, Facebook, and TikTok, track daily momentum in Today's Snapshot, or see how your school compares with the free Opportunity Assessment.
Numbers are only half the picture: what a team can actually do about them depends on how the accounts are staffed and governed, which is the subject of social media management for higher education — the calendar, the approval path, and the portfolio of handles an institution ends up responsible for.
Methodology
Reach analyzes rolling 30-day Instagram, Facebook, and TikTok performance across tracked higher education accounts. Engagement rate is calculated per post, as that post's engagements divided by follower count, then averaged across the window. Benchmarks are grouped by school size, account type, division, location, and level.
- Account scope includes primary university and related institutional accounts in the higher ed benchmark universe, limited to accounts with published posting history. Catalog entries we have not collected data for are excluded rather than counted as zeros.
- Engagement metrics include likes, comments, and platform-native interactions available in the reporting window.
- Data refreshes daily with rolling windows so benchmark trends remain current for planning and reporting.
- Account-level figures average one value per account, so every school counts equally regardless of size. Media-type and content-category figures average one value per post, so schools that publish more contribute more.
- Content share in Top Content Types is the share of posts tagged with each category. A post can carry more than one category, so shares add up to more than 100%.
Frequently asked questions
It depends on the platform. In the current rolling 30-day dataset, average engagement rates for main university accounts are Instagram at 1.89%, Facebook at 0.26%, TikTok at 5.25%. A good target is to consistently outperform peer institutions of similar size and profile on each platform.
Instagram, Facebook, and TikTok are the three core organic channels this dataset tracks, covering 3,960 higher ed accounts. Instagram typically anchors admissions marketing, Facebook reaches parents and alumni, and TikTok reaches prospective students earliest in their search.
Current 30-day benchmark cadences per account are 14 posts on Instagram, 10 posts on Facebook, 5 posts on TikTok. Treat these as baselines — consistency and content quality move engagement more than raw volume.
Compare against peers on each platform separately, cut by school size, division, location, and account type. Cross-platform comparisons of raw engagement rates mislead because platform mechanics differ — a strong Facebook number can be a weak Instagram number.
Reach analyzes rolling 30-day performance across tracked higher education accounts on each platform. Engagement rate is calculated per post, as that post's engagements divided by follower count, then averaged across the window. Data refreshes daily.
Yes. The platform benchmark pages are free and update daily. For your school's own numbers side-by-side with competitors, run the free Opportunity Assessment or subscribe to The Reach Report for weekly insights.
Where does your school stand?
Benchmarks tell you the field — the free Opportunity Assessment tells you your position in it. Compare your school's follower growth, engagement, and content mix head-to-head against competitors in about 60 seconds. No account needed.
Get insights like this in your inbox weekly
The Reach Report delivers fresh higher ed social media data, trends, and campaign ideas every week — free, from the team behind these benchmarks.
Free forever. Unsubscribe anytime.