
Higher Ed Facebook Benchmarks for Colleges & Universities
Compare engagement rates, follower growth, posting frequency, and content performance across 1,131 higher ed Facebook accounts.
Overall Performance
Rolling 30-day averages across all main accounts
0.26%
Engagements ÷ followers
0.32%
Monthly average
10
Posts per account
0.31%
Engagement rate
0.2%
Engagement rate
3.92
Rolling 30-day avg
Benchmarks by Category
Compare performance across different institutional segments
| School Size | Accounts | Avg Followers | Growth % | Engagement Rate | Avg Posts (30d) | Avg Comments |
|---|---|---|---|---|---|---|
| Under 1K | 262 | 20.2K | +0.14% | 0.4% | 5 | 1.6 |
| 1K – 5K | 438 | 34.1K | +0.41% | 0.33% | 9 | 3.1 |
| 5K – 10K | 192 | 58.6K | +0.37% | 0.12% | 8 | 2.5 |
| 10K – 20K | 123 | 142.1K | +0.4% | 0.1% | 18 | 4.9 |
| 20K – 30K | 61 | 298.8K | +0.26% | 0.15% | 22 | 13.7 |
| 30K+ | 55 | 343.0K | +0.19% | 0.1% | 26 | 13.3 |
Top Content Types
Most posted content categories in the last 30 days
Today's Top Facebook Posts in Higher Ed
The highest Facebook engagement rates in the last daily snapshot — what beating these benchmarks actually looks like
@
2 days ago
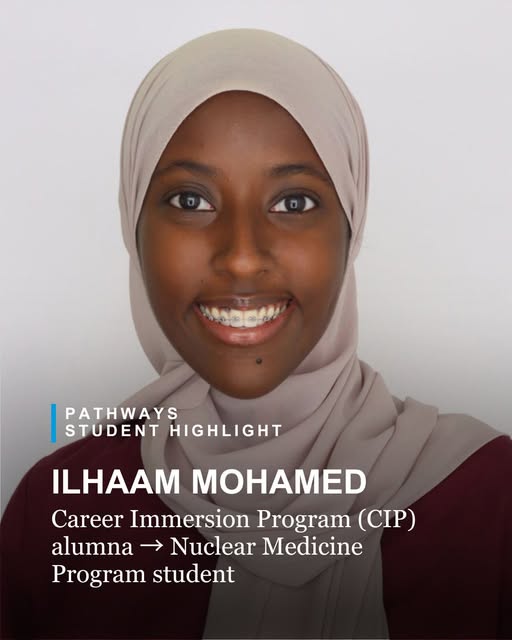
One summer program helped her discover her future in Nuclear Medicine. Before participating in Mayo Clinic's Career Immersion Program, Ilhaam Mohamed knew about only a handful of healthcare professions. Through the program, she explored a variety of careers and gained a deeper understanding of the many ways healthcare teams contribute to patient care. Sessions focused on Nuclear Medicine and physical therapy captured her attention, introducing her to fields she had not previously considered. The experience ultimately inspired her to pursue Nuclear Medicine as a career. To prepare for that future, Ilhaam gained clinical experience through phlebotomy and continued building the skills needed to work with patients. This fall, she will begin Mayo Clinic's Nuclear Medicine Program. Her story demonstrates how pathways programs help learners explore possibilities, discover interests and take meaningful steps toward healthcare careers.
@
2 days ago

Welcome to campus, Wolves! You are officially home. 🐺💚💛 Thank you to all the staff and volunteers who helped make move-in day a smooth start to the new year! #KeukaCollege #KCFamily #MoveInDay
@
2 days ago

Proud to be ranked #1 on LinkedIn’s Best Colleges for Job Placement—for the second year in a row! Rose-Hulman grads are launching their careers and taking on the world right after graduation. 🚀
This is one slice of Today's Snapshot
The full daily report adds AI-picked standout posts, trending hashtags, fastest-growing schools, and engagement by content type — refreshed every morning at 9 AM ET.
Higher Ed Benchmark Insights
Plain-English context to help your team understand what the current rolling 30-day numbers mean in practice.
In the latest rolling 30-day window, this dataset tracks 1,131 higher ed Facebook accounts. The average engagement rate is 0.26%, average follower growth is 0.32%, and schools publish 10.0 posts per account over 30 days.
The most common content type is Campus Life at 23.80% of total posts. That does not automatically mean it is the highest-performing format, so teams should compare share and engagement together before changing creative mix.
Use these benchmarks as directional context for peer-group planning. Focus first on consistent cadence, then on format-level performance by school size, account type, and division to find realistic gains.
Compare this with TikTok benchmarks for higher education, track daily momentum in Today's Snapshot, and explore higher ed social media management with Reach.
Facebook's staying power in higher education is mostly an audience-age story, which is why it carries the most weight in social media management for alumni relations, where class-year groups are often the last place a cohort still gathers on its own.
Methodology
Reach analyzes rolling 30-day Facebook performance across tracked higher education accounts. Engagement rate is calculated per post, as that post's engagements divided by follower count, then averaged across the window. Benchmarks are grouped by school size, account type, division, location, and level.
- Account scope includes primary university and related institutional accounts in the higher ed benchmark universe, limited to accounts with published posting history. Catalog entries we have not collected data for are excluded rather than counted as zeros.
- Engagement metrics include likes, comments, and platform-native interactions available in the reporting window.
- Data refreshes daily with rolling windows so benchmark trends remain current for planning and reporting.
- Account-level figures average one value per account, so every school counts equally regardless of size. Media-type and content-category figures average one value per post, so schools that publish more contribute more.
- Content share in Top Content Types is the share of posts tagged with each category. A post can carry more than one category, so shares add up to more than 100%.
Explore More Reports
Dive into benchmarks across platforms and Today's Snapshot
All Platforms Overview
Instagram, Facebook & TikTok benchmarks side by side across higher ed social.
View OverviewToday's Snapshot
Daily top posts, trending hashtags & engagement insights across all platforms.
View SnapshotInstagram Benchmarks
Engagement rates, follower growth & content performance for higher ed Instagram accounts.
View BenchmarksTikTok Benchmarks
Video engagement, carousel performance & growth trends for higher ed TikTok accounts.
View BenchmarksFrequently asked questions
In this rolling 30-day dataset, the average Facebook engagement rate is 0.26%. A good result is one that is consistently stronger than your closest peer institutions.
The benchmark currently shows 10.0 posts per account in 30 days. Use that as a planning anchor, then tune cadence based on content quality and campaign goals.
Format performance differs by audience and account strategy. Compare media-type engagement and content share together to decide where to invest.
Use peer-group cuts by institutional profile and compare trends over time. Current average follower growth in this benchmark is 0.32%.
Reach calculates engagement rate per post, as that post's engagements divided by follower count, then averages those rates across a rolling 30-day period so schools can compare accounts on a normalized basis.
Want deeper insights?
Create custom benchmark reports for any IPEDS metric — religious affiliation, institutional control, state, conference, and endless combinations. See how your school stacks up against the exact peer group that matters to you.